Chart utiliy and data visualization
Working through every chart use case
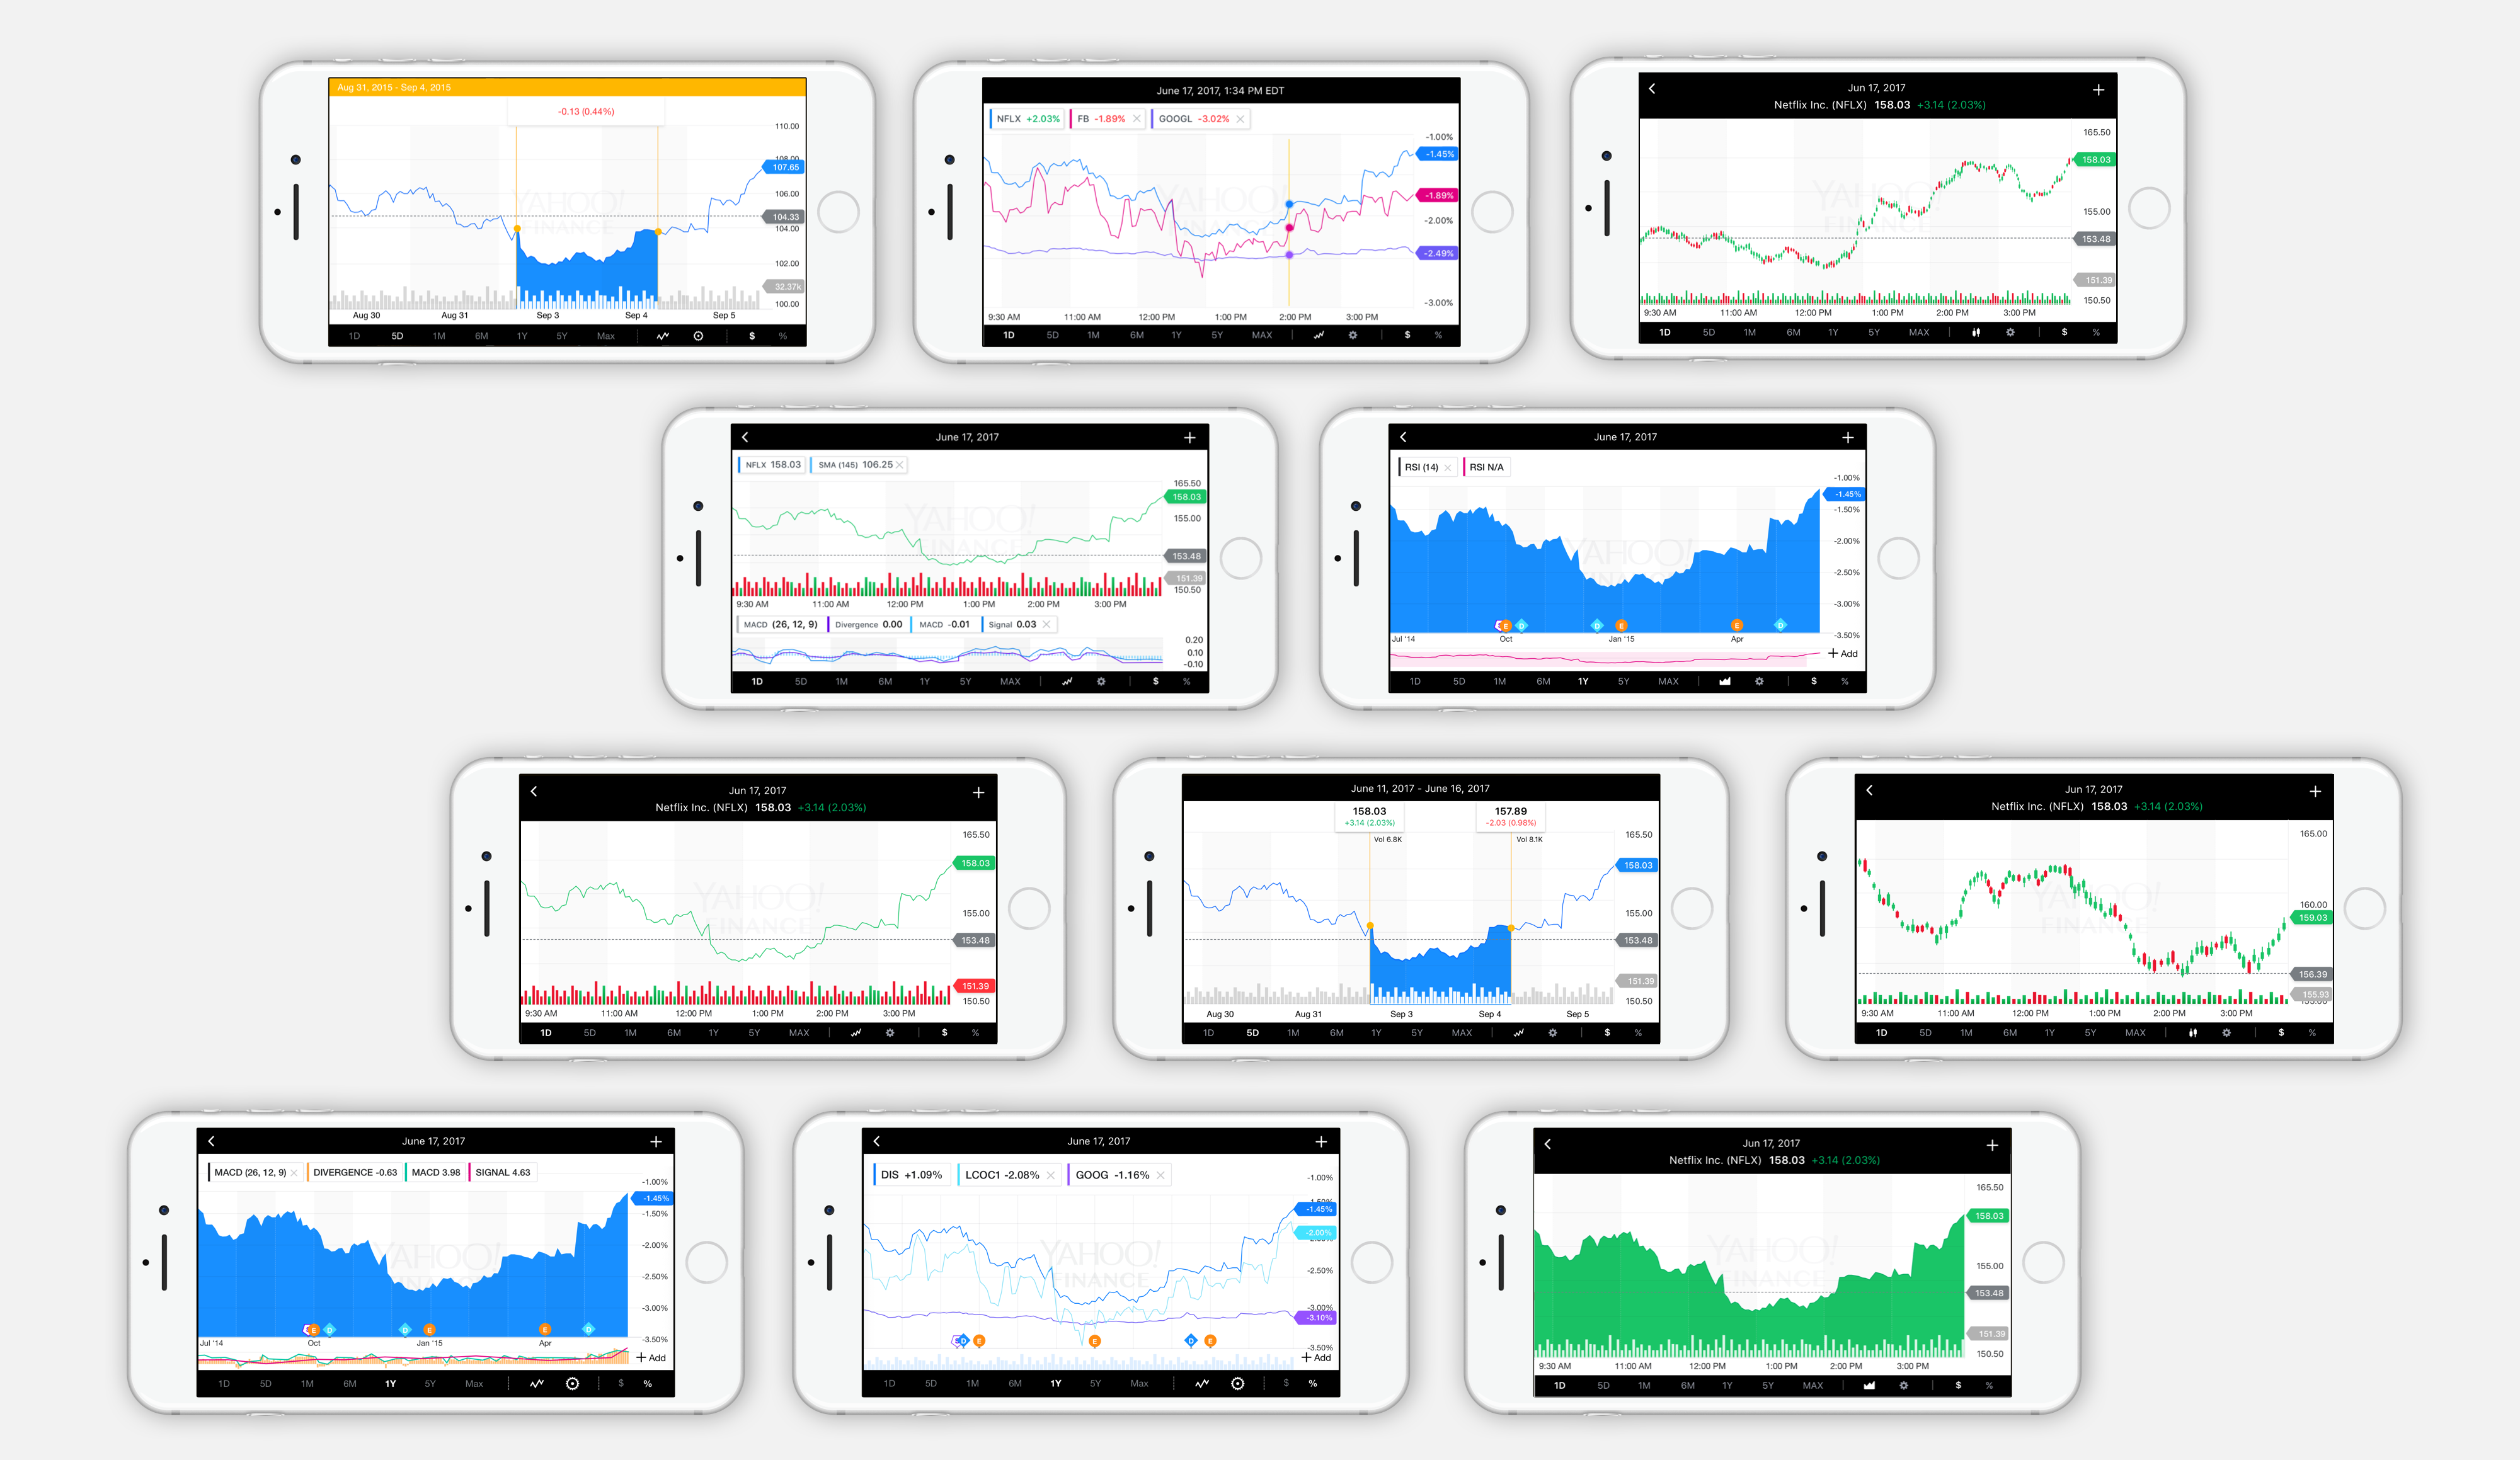
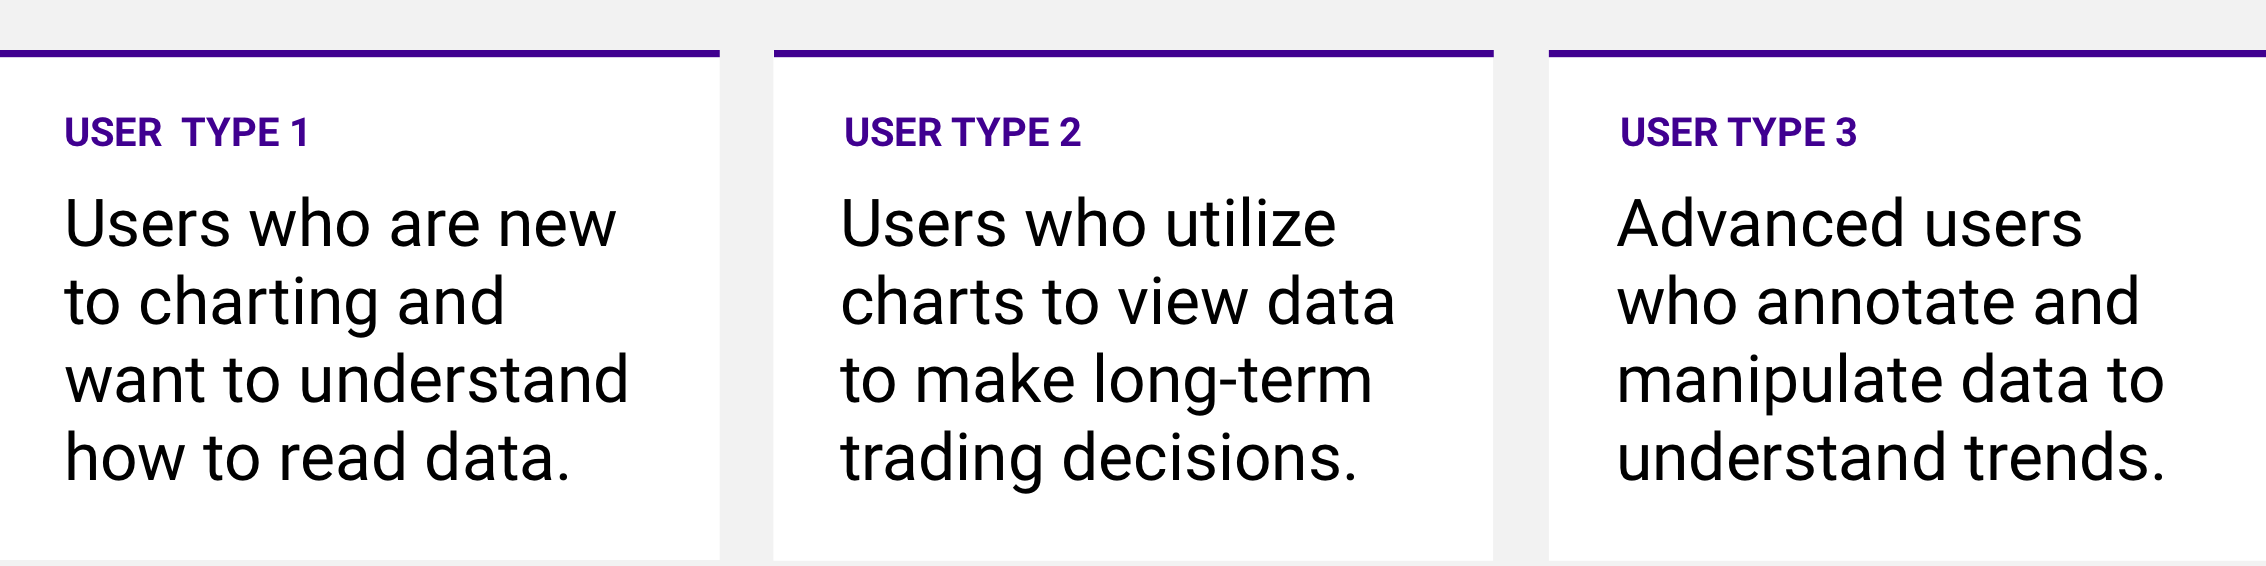
Charts was a complicated topic, we had many different users from all levels using charts for different purposes
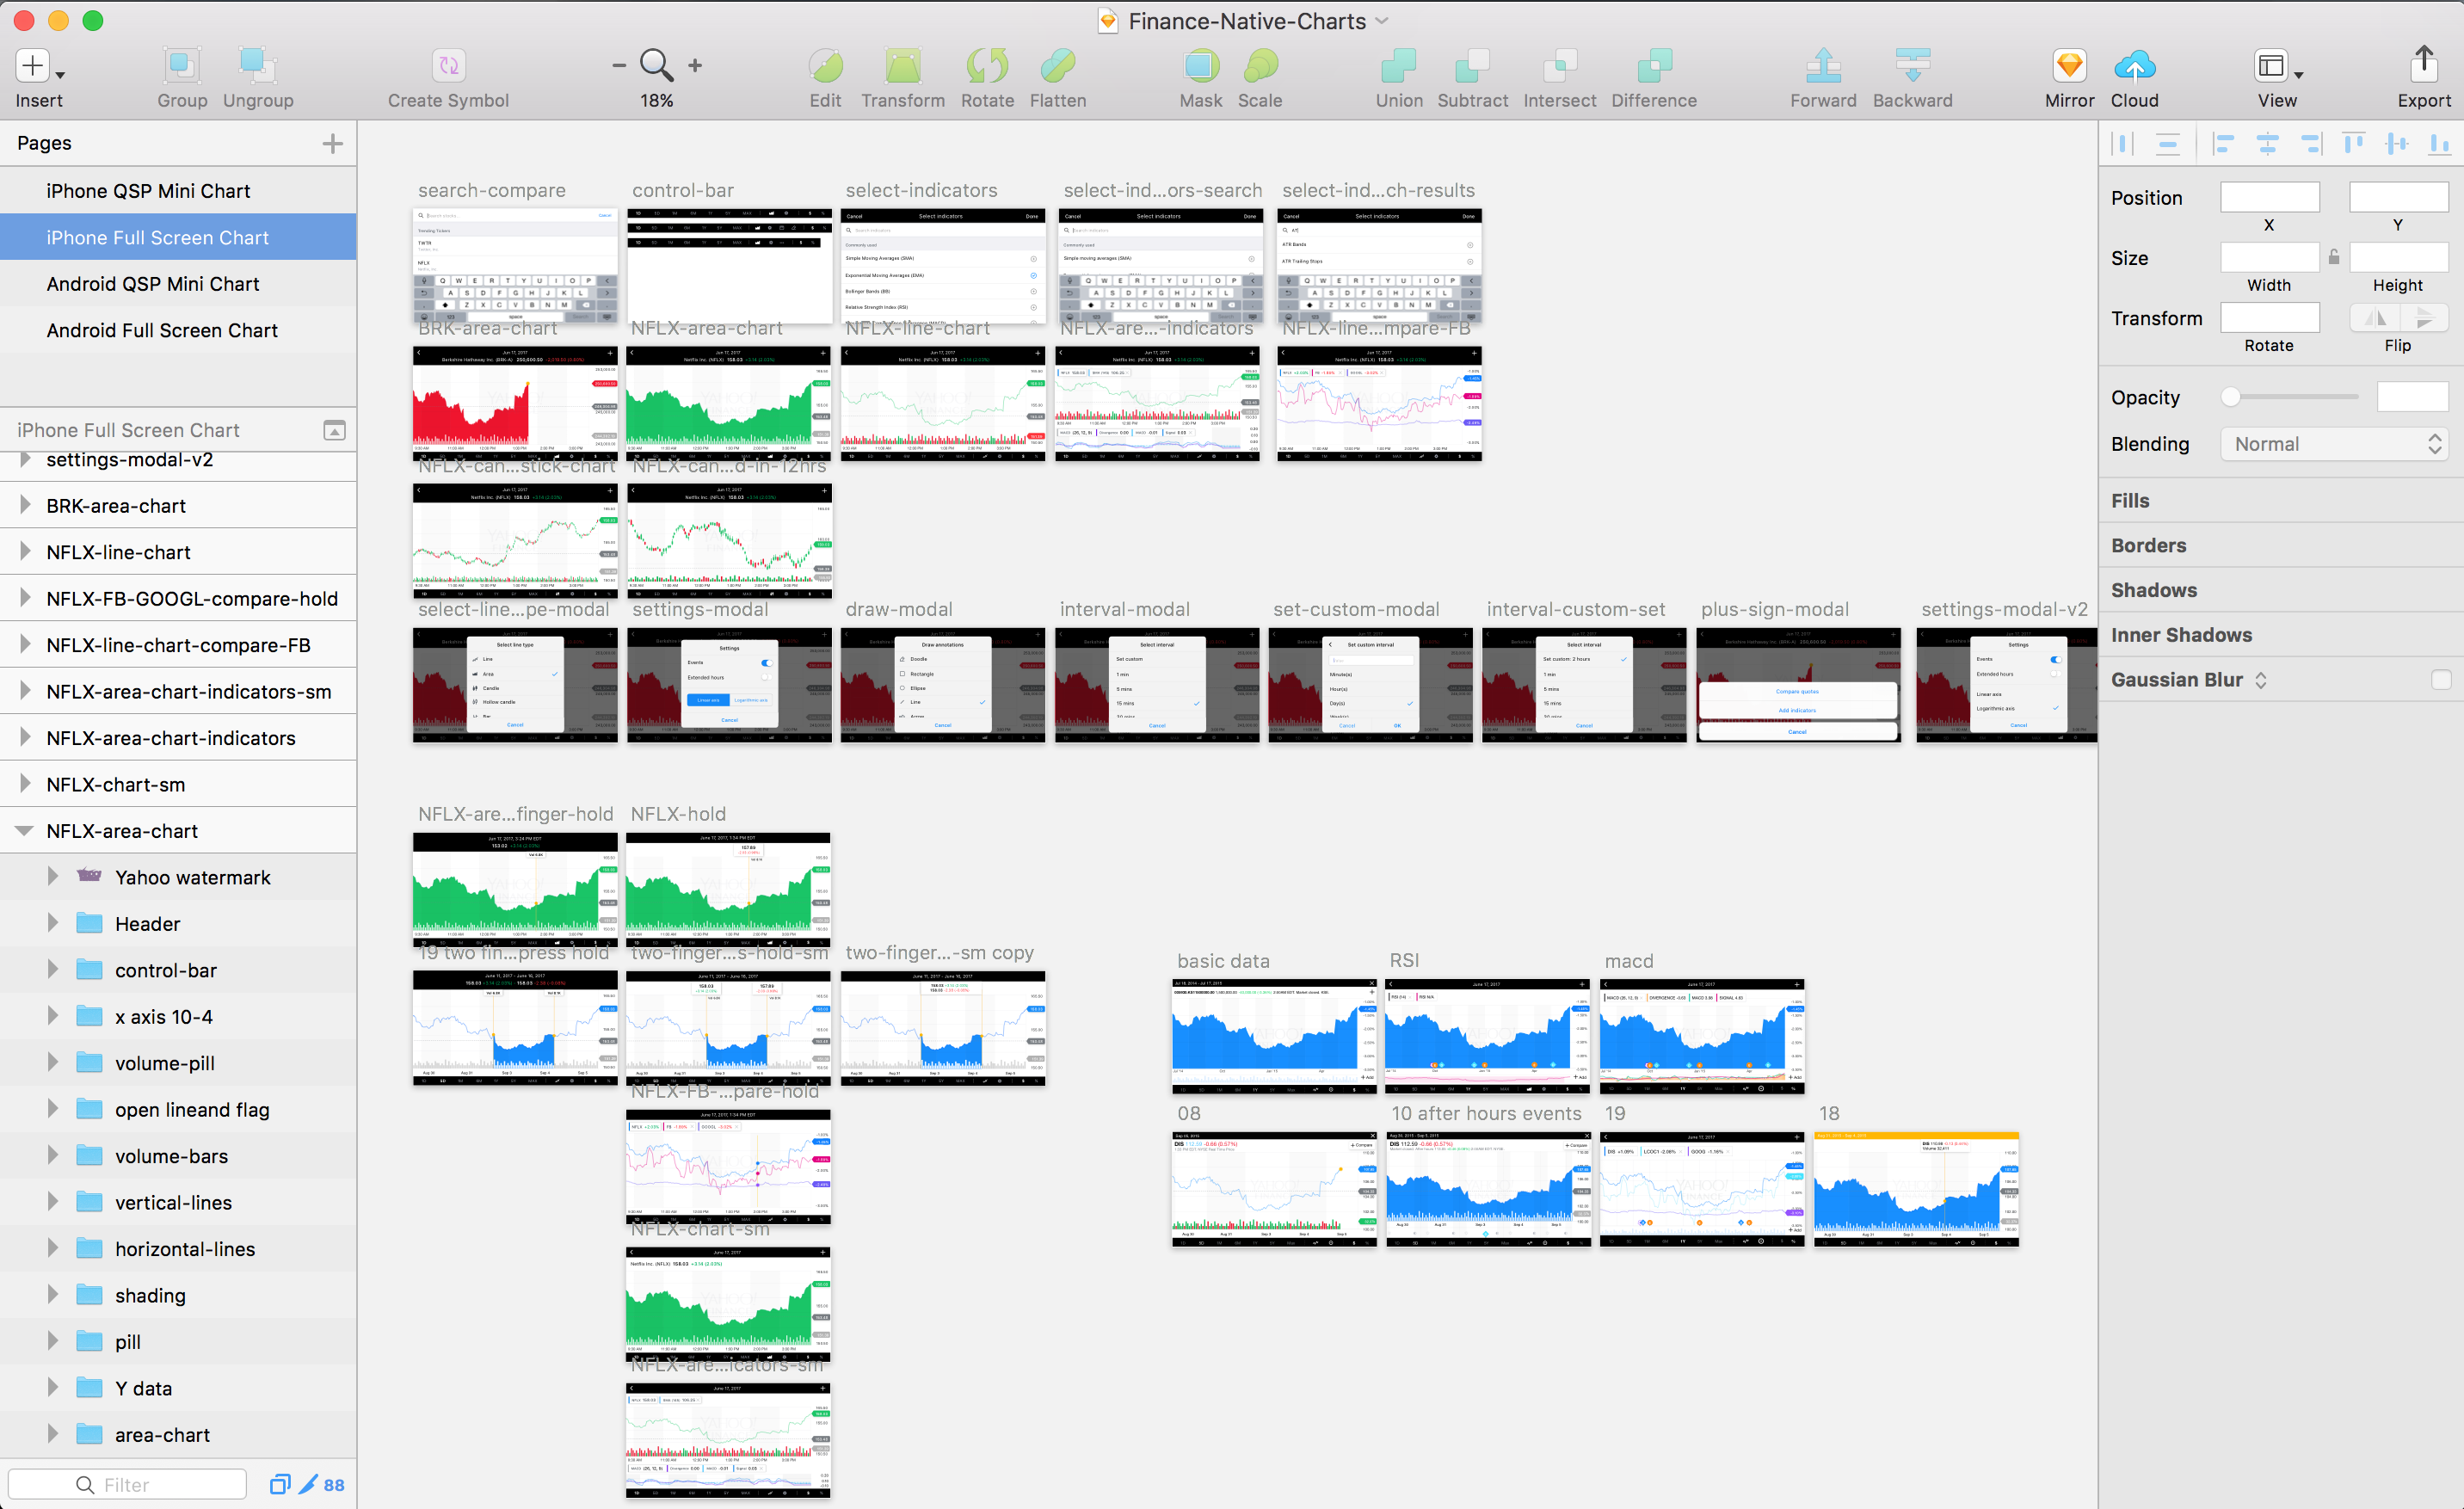
User Research & Iterating
Feature Request: Users wanted the ability to change chart type in mobile.
Solution: We added the ability to change between different types.
Feature Request: Users wanted the ability to change time.
Solution: We added the ability to change between different types.
Feature Request: Users wanted the ability to add indicators.
Solution: We added the ability to change between different types.
This project is still currently work in progress for Q3.